Kaitlin, Julia and I have been busy. Not that you’d know. It’s been a lot of behind the scenes work so far on this project- it’s started with weekly meetings where we talk out our ideas and approaches. You’ll recall, the bad breakup project is an algorithm I designed to mine data from the perspective of a human who was looking to find statistically significant trends. Essentially, it asks “Given a snippet of data, what conclusion would a typical biologist applying typical statistics make about these data?”* We were going to use the 58,000 datasets compiled through the US-LTER over its 40 year history as our data fuel- with the longest series (the complete record) serving as a proxy for truth.**
Turns out, this problem that we’re working on is pretty big, so establishing exactly how to approach these 58,000 archival datasets is our main challenge. It looks kinda like this:
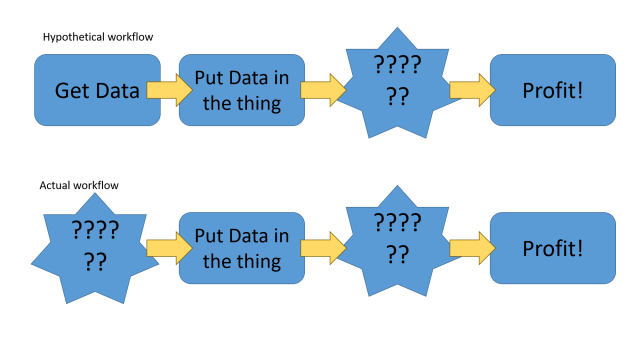
A crudely constructed powerpoint flowchart. Top row: Hypothetical workflow- Get data > put data in the thing > ?????? > Profit! Bottom row: Actual workflow- ?????? > Put data in the thing > ?????? > Profit!
Our collaborator, Sarah Cusser at Michigan State, has had amazing successes in the context of a ‘deep look’ at a single long term experiment- she has been examining how long we have to watch a system to see treatment differences across several common agricultural practices- and how consistent this effect is. Her findings, in prep right now, can be used to make recommendations about how we make recommendations to farmers- essentially when can we be confident our recommendations are right, and when should we moderate our confidence, when guiding how farmers select practices.
Building on the idea of the deep dive, Kaitlin got an idea- what if we specifically sought out datasets that document tritrophic interactions from the LTER- we could use these focal datasets to examine within-site patterns between trophic levels- i.e. do misleading results travel together between trophic levels? A brilliant idea, so Julia sat down and started combing the organismal abundance/plant biomass data across the LTER- and proceeded to spend a lot of time spinning her wheels.
The challenge, it seems, is also one of LTER’s strengths. LTER data is available through two paths- in data archives set by individual sites, and centrally, through a portal at DataONE. There is a heck of a lot of stuff going on at each individual LTER site, which is so, so awesome and cool and I love learning from it***, but, given that each site is so unique, navigating between them to try and find information which supports synthetic approaches is…okay, I’m not going to mince words, not awesome****. Julia has been working on LTER related projects for nearly a decade now***** and found that the DataOne catalog was fine if she knew what she was looking for, but it wasn’t easy to browse, while extracting meaning from anything. She quickly found the individual sites were, generally, superior from a browsing perspective, because each site gave a bit of context about what the sites actually are, what the major experiments were, and their data. The data catalogs at each site, though, were all slightly different, and thus varied in their ease of navigation- and moving between the sites, the approaches differed. So she’s still chipping away at this.
Meanwhile, though, something big hit the news. The INSECT DECLINE THING.
Oh boy. So, I am going to summon the full authority of my position as your friendly local data scientist, insect ecologist and time series expert. This study has some serious design flaws and its results are unreliable******. Manu Saunders wrote an excellent blog post on the subject so I won’t go into it in detail here. But our group sat down and discussed the study at one of our regular meetings, and realized we were perhaps in one of the best positions to critically, quantitatively examine these claims- so we got to work. More on this soon.
Soon after we got started, a reporter from Discover magazine reached out to Kaitlin for comment on the story, and a truly excellent article resulted.
To quote a quote from the article:
“You can’t just draw a line through some data points, take it down to zero and say, ‘Right, that’s how long we’ve got,’” Broad says. “That’s not how stats works, it’s not how insect populations work, either.”
Later in the article, Kaitlin highlights how we’re addressing these problems in the work we’re doing– and examines why the scientists making these dire extrapolations are reaching the conclusions they do.
I’m really excited to see what we find.
——-
* my long term goal is to replace typical biologists making typical conclusions with about 185 lines of well commented R code by 2027
** It’s a proxy because even the longest time series I have is a snippet of the whole story. Ever since I started partying with sociologists, I find I use phrases like “proxy for truth” in my day-to-day more than I’d like to admit. Wait till we write our book together.
*** Can you tell that I have a deep, deep, identity-defining love for LTER? Because I do.
**** MAXIMUM CANADIAN SHADE.
***** Just to make you feel old, Juj.
****** DOUBLE MAXIMUM CANADIAN SHADE. NOT MANY CAN SURVIVE THIS LEVEL OF SHADE

> but, given that each site is so unique, navigating between them to try and find information which supports synthetic approaches is…okay,
…is what has prevented me from trying to use LTER data during my dissertation. Although I haven’t explored the data interface in at least a year (maybe it’s gotten a lot better), from what I remember, it was a bit cumbersome to identify which data could be useful, and to download these individual data.
Pingback: How do I find stuff? An undergraduate’s journey through an online data archive | Practical Data Management for Bug Counters